spapros.ev.ProbesetEvaluator.plot_cluster_similarity
- ProbesetEvaluator.plot_cluster_similarity(set_ids=None, selections_info=None, **kwargs)
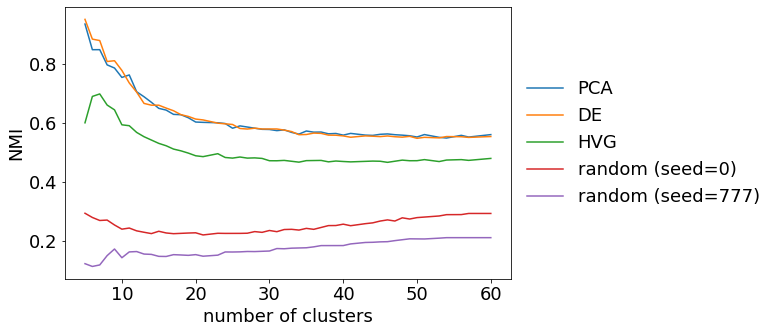
Plot cluster similarity as NMI over number of clusters
- Parameters:
set_ids (List[str]) – List of probeset IDs. Check out
ProbesetEvaluator.summary_resultsfor available sets.selections_info (Optional[DataFrame]) –
Information on selections for plotting. The dataframe includes:
selection ids or alternative names as index
column: path (mandatory if
data=None): path to results csv of each selection (which contains number of clusters (as index) and one column containing the data to plot)optional columns:
color: matplotlib color
linewidth: matplotlib linewidth
linestyle: matplotlib linestyle
<groupby>: some annotation that can be used to group the legend
Note that the legend order will follow the row order in
selections_info.**kwargs – Any keyword argument from
cluster_similarity().
- Return type:
None
Example
(Takes a few minutes to calculate)
import spapros as sp
adata = sp.ut.get_processed_pbmc_data()
selections = sp.se.select_reference_probesets(
    adata, methods=["PCA", "DE", "HVG", "random"], n=30, seeds=[0, 777], verbosity=0)
evaluator = sp.ev.ProbesetEvaluator(
    adata, verbosity=0, results_dir=None, scheme="custom", metrics=["cluster_similarity"])
for set_id, df in selections.items():
    gene_set = df[df["selection"]].index.to_list()
    evaluator.evaluate_probeset(gene_set, set_id=set_id)

evaluator.plot_cluster_similarity()