spapros.ev.ProbesetEvaluator.plot_marker_corr
- ProbesetEvaluator.plot_marker_corr(**kwargs)
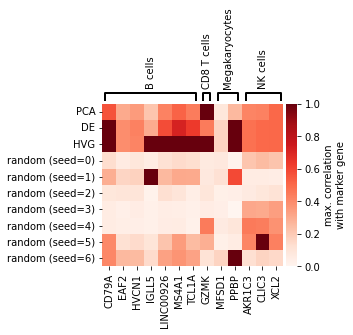
Plot maximal correlations with marker genes
- Parameters:
**kwargs – Any keyword argument from
marker_correlation().
Example
import spapros as sp
marker_list ={
    'B cells': ['EAF2', 'MS4A1', 'HVCN1', 'TCL1A', 'LINC00926', 'CD79A', 'IGLL5'],
    'NK cells': ['XCL2', 'CLIC3', 'AKR1C3'],
    'CD8 T cells': ['GZMK'],
    'Dendritic cells': ['FCER1A', 'CLEC10A'],
    'Megakaryocytes': ['RGS18','C2orf88','SDPR','TMEM40','GP9','MFSD1','PF4','PPBP'],
}
adata = sp.ut.get_processed_pbmc_data()
selections = sp.se.select_reference_probesets(
    adata, methods=["PCA", "DE", "HVG", "random"], n=30, seeds=range(7), verbosity=0)
evaluator = sp.ev.ProbesetEvaluator(
    adata, verbosity=0, results_dir=None, scheme="custom", metrics=["marker_corr"], marker_list=marker_list)
for set_id, df in selections.items():
    gene_set = df[df["selection"]].index.to_list()
    evaluator.evaluate_probeset(gene_set, set_id=set_id)

evaluator.plot_marker_corr()