spapros.pl.masked_dotplot
- spapros.pl.masked_dotplot(adata, selector, ct_key='celltype', imp_threshold=0.05, celltypes=None, n_genes=None, comb_markers_only=False, markers_only=False, cmap='Reds', comb_marker_color='darkblue', marker_color='blue', non_adata_celltypes_color='grey', use_raw=False, save=False)
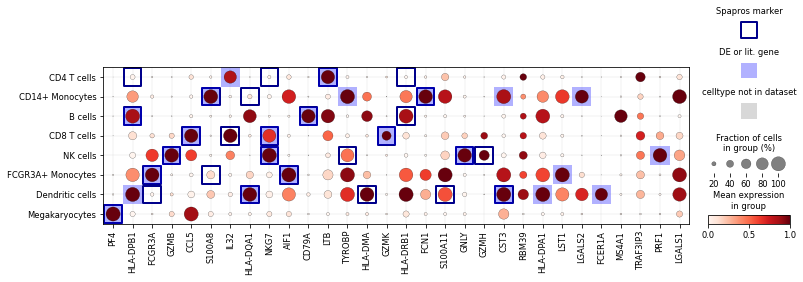
Create dotplot with additional annotation masks.
- Parameters:
adata (AnnData) – AnnData with cell type annotations in adata.obs[ct_key].
selector – ProbesetSelector object with selected selector.probeset.
ct_key (str) – Column of adata.obs with cell type annotation.
imp_threshold (float) – Annotate genes as “Spapros marker” only for those genes with importance >
imp_threshold.celltypes (Optional[List[str]]) – Optional subset of celltypes (rows of dotplot).
n_genes (Optional[int]) – Optionally plot top
n_genesgenes.comb_markers_only (bool) – Whether to plot only genes that are “Spapros markers” for the plotted cell types. (can be combined with markers_only, in that case markers that are not Spapros markers are also shown)
markers_only (bool) – Whether to plot only genes that are markers for the plotted cell types. (can be combined with
comb_markers_only, in that case Spapros markers that are not markers are also shown)cmap (str) – Colormap of mean expressions.
comb_marker_color (str) – Color for “Spapros markers”.
marker_color (str) – Color for marker genes.
non_adata_celltypes_color (str) – Color for celltypes that don’t occur in the data set.
use_raw (bool) – Whether to use adata.raw for plotting.
save (Union[Literal[False], str]) – If True or a str, save the figure.
Example
(Takes a few minutes to calculate)
import spapros as sp
adata = sp.ut.get_processed_pbmc_data()
selector = sp.se.ProbesetSelector(adata, "celltype", n=30, verbosity=0)
selector.select_probeset()

sp.pl.masked_dotplot(adata,selector)