spapros.se.ProbesetSelector.plot_coexpression
- ProbesetSelector.plot_coexpression(selections=['final', 'pca', 'DE', 'marker', 'pre', 'prior'], **kwargs)
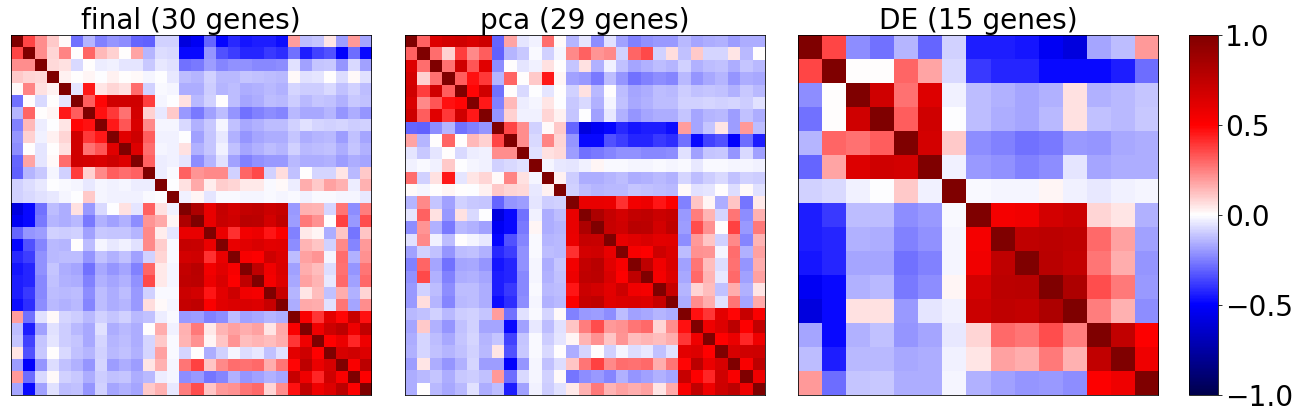
Plot correlation matrix of selected genes
- Parameters:
selections (List[str]) –
Plot the coexpression of
’final’ : all selected genes (see
ProbesetSelector.probeset)’pca’ : selected genes that also occured in the pca based selection
’DE’ : selected genes that also occured in the 1-vs-all DE based selection
’marker’ : selected genes from the marker list
’pre’ : selected genes that were given as pre selected genes
’prior’ : selected genes that were given as prioritized genes
kwargs – Any keyword argument from
correlation_matrix().
- Return type:
None
Example
(Takes a few minutes to calculate)
import spapros as sp
adata = sp.ut.get_processed_pbmc_data()
selector = sp.se.ProbesetSelector(adata, "celltype", n=30, verbosity=0)
selector.select_probeset()

selector.plot_coexpression()